monday.com Dashboards: real-time visibility for better project management
January 7, 2026
Modern project management is no longer just about assigning tasks and meeting deadlines: it’s about having real-time visibility, making informed decisions quickly, and keeping teams aligned as priorities change.
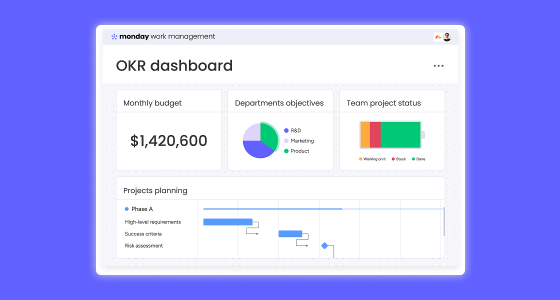
This is why monday.com dashboards have become a critical tool for project managers, PMOs, and business leaders. They centralize project management analytics, simplify KPI tracking, and give teams a clear picture of progress, risks, and performance—all in one place!
Instead of relying on static reports or endless status meetings, dashboards allow you to see what’s happening as work unfolds and act before small issues turn into major delays.
Most organizations struggle not because they lack data, but because their data is spread across multiple tools. Tasks in one place, timelines in another, and KPIs buried in spreadsheets.
With monday.com dashboards, teams can:
This level of visibility reduces friction, improves collaboration, and enables faster, more confident decision-making.
Not all stakeholders need the same information. Executives, project managers, and delivery teams look at projects from different angles—and custom dashboards make that possible.
monday.com allows you to tailor dashboards based on roles, objectives, and KPIs, ensuring everyone sees what matters most to them without losing context.
Key benefits of custom dashboards include:
When dashboards are built around real needs, they stop being reporting tools and become daily decision-making assets.
Before adding widgets or charts, it’s important to define what decisions the dashboard should enable. The most effective project management dashboards are designed with intent, not aesthetics.
Ask yourself:
This approach ensures your dashboards stay relevant, actionable, and easy to adopt.
One of the reasons monday.com stands out is how easy it is to build dashboards (no technical background required!)
You simply select the boards you want to connect and add widgets that visualize timelines, workload, KPIs, or risks. Some of the most commonly used widgets include:
Each widget can be filtered and customized, allowing teams to focus on what’s most relevant at any given moment.
An effective dashboard doesn’t try to show everything. Instead, it highlights what requires attention now.
Best practice is to surface critical information first (like overdue tasks, milestones at risk, or key KPIs) while keeping supporting details accessible below. This structure helps teams quickly understand priorities and take action without unnecessary noise.
Well-designed dashboards lead to shorter meetings, faster decisions, and smoother execution.
Dashboards shouldn’t be static. As projects scale and priorities shift, your dashboards should evolve too.
With monday.com, you can enhance dashboards using:
This transforms dashboards into living systems that actively support project delivery, not just report on it.
While KPIs vary by organization, some metrics consistently support better project outcomes:
The key is relevance. When teams understand why a metric matters, dashboards become tools for execution and not for control.
monday.com dashboards adapt to different teams and industries while delivering the same core value: clarity and alignment.
Different perspectives, one shared platform.
Successful project management depends on seeing clearly, deciding quickly, and acting confidently.
monday.com dashboards make this possible by turning real-time data into actionable insights that teams can trust. When everyone works from the same, up-to-date view, collaboration improves, accountability increases, and project delivery becomes more predictable.
If your organization is still relying on spreadsheets, static reports, or disconnected tools, dashboards are a powerful next step.
👉 Talk to our experts and discover how monday.com dashboards can be tailored to your projects, teams, and KPIs.


