Making data-driven decisions is no longer optional for IT teams, it’s a must. As request volumes increase and resources remain limited, the difference between an agile team and an overwhelmed one lies in the ability to access clear, reliable, real-time information.
Freshservice, a leading ITSM platform known for its intuitive and innovative approach, meets this need with powerful reporting and analytics tools. Its features go beyond basic metrics, they uncover patterns, optimize resource allocation, and turn service desk operations into a strategic advantage.
In this article, we’ll explore how to get the most out of Freshservice dashboards, operational reports, and data analysis. If your goal is to strengthen your metrics, anticipate bottlenecks, and drive continuous improvement, you’ll find exactly what you need to get there.
Why Reporting and Analytics Matter for IT Service Management
Before delving into specific features and tactics, it’s essential to understand why reporting and analytics are fundamental for effective IT service management:
- Resource Optimization: With accurate data, IT managers can better allocate resources, balance workloads, and justify future staffing decisions based on historical trends.
- Insight into Performance: Service desk reports and ITSM metrics help you objectively measure how your IT team is performing against SLAs and internal benchmarks.
- Proactive Problem-Solving: Analytics can help you quickly identify recurring issues, enabling root-cause analysis and prevention rather than reactive firefighting.
- Continuous Improvement: Regularly reviewing Freshservice dashboards enables continuous monitoring and allows you to set meaningful targets for IT performance analysis.
- Stakeholder Reporting: Senior management, auditors, and external partners often require clear, data-driven reports for compliance and decision support.
Without a strong reporting and analytics foundation, IT departments are left to operate based on guesswork, which increases risk and stifles innovation.
Exploring Freshservice’s Built-in Reporting & Analytics Capabilities
Freshservice comes equipped with a comprehensive, user-friendly reporting engine designed to deliver insights right out of the box:
- Pre-Built Reports: Gain instant clarity on key ITSM metrics like ticket volume, SLA compliance, satisfaction ratings, and first-contact resolution.
- Custom Reports: Easily create reports tailored to your organization’s unique KPIs using drag-and-drop widgets and flexible data filters.
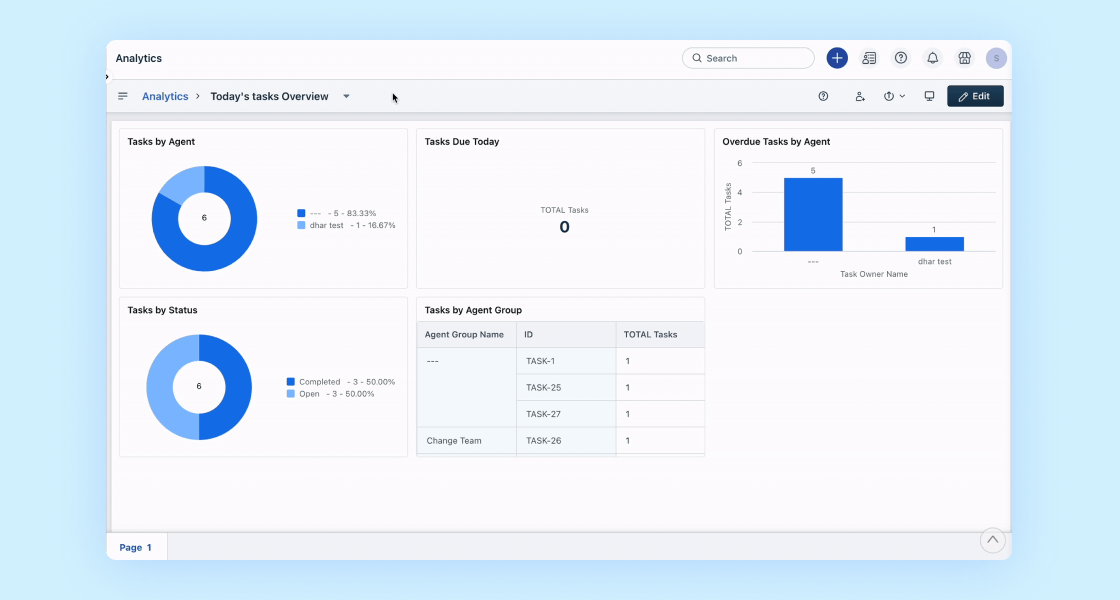
- Visual Dashboards: Build visually engaging Freshservice dashboards to quickly monitor the metrics that matter using charts, graphs, and widgets.
- Scheduled Reporting: Automate report delivery to yourself or other stakeholders at regular intervals.
- Advanced Analytics: Leverage trend analysis, cohort segmentation, and comparative metrics for deeper IT performance analysis.
Key ITSM Metrics to Track in Freshservice
The most critical ITSM metrics to monitor for optimal service desk performance:
- Ticket Volume: Total number of incidents, requests, or changes, segmented by department, agent, or support group.
- First Response Time: The average time taken to respond to a ticket, which directly affects customer satisfaction.
- Resolution Time: The average time taken to fully resolve issues.
- SLA Compliance Rate: Percentage of tickets resolved within agreed SLAs.
- Customer Satisfaction (CSAT): Feedback scores post-resolution, surfacing trends in end-user experience.
- Agent Performance: Metrics such as tickets handled, resolution rates, and backlog trends.
- Repeat Incidents: Identifies recurring problems that may require structural fixes.
- Change Success Rate: Tracks the effectiveness of change management.
Setting Up Custom Dashboards in Freshservice
Follow these steps to create an impactful dashboard tailored to your team’s needs:
- Identify Your Audience: Decide who the primary users are and what insights are most relevant.
- Select Key Metrics: Choose which data points and KPIs you want to track.
- Build Widgets: Use Freshservice’s drag-and-drop interface to add charts, graphs, and tables. Popular widgets include bar graphs for ticket trends, pie charts for SLA adherence, and heat maps for workload distribution.
- Apply Filters: Refine your data by time period, category, agent, or location.
- Automate Refreshes: Set dashboards to auto-refresh for real-time visibility.
Extracting Actionable Insights: Practical Examples
Common scenarios where Freshservice analytics help drive real improvement:
- SLA Breaches: Use detailed incident reports to identify whether breaches cluster around certain times, departments, or ticket types.
- Agent Workload Balancing: Analyze ticket assignments and resolution rates by agent to redistribute load or automate ticket routing.
- Recurring Incidents: Use historical ticket data to spot patterns of repeated issues.
- Change Failure Patterns: Track which changes are most often rolled back or trigger incidents.
- Customer Satisfaction Drops: Correlate CSAT score dips with changes in ticket volume, agent shifts, or ticket handling times.
Optimizing Resource Allocation with Data-Driven ITSM
Freshservice reporting sheds light on workload trends and enables smarter decision-making:
- Peak Period Logging: Analyze historical ticket volume day-by-day to identify organizational peaks for shift planning.
- Service Category Trends: Track which service categories generate the most tickets over time to forecast resource requirements.
- Agent Performance Benchmarks: Compare resolution rates and response times to spot high performers.
- Resource Forecasting: Use trend analysis to predict future spikes in demand.
Best Practices for Maximizing Value from Freshservice Analytics
To get the most from Freshservice dashboards and service desk reports:
Enabling Continuous Improvement with Real-Time IT Performance Analysis
Freshservice dashboards let you monitor current workload, SLA breaches, open changes, and high-priority incidents as they happen via live dashboards, instant notifications, and trend monitoring of key ITSM metrics.
Real-World Examples: How Organizations Use Freshservice Reporting
Across industries, organizations are leveraging the power of data-driven ITSM using Freshservice analytics — from higher education managing campus-wide tech support, to healthcare providers maintaining HIPAA compliance metrics, to manufacturing firms triggering preventive maintenance programs.
Getting Started: Tips for a Smooth Implementation
Engage stakeholders early, start with pre-built dashboards, ensure data quality, train your team, and regularly review and refine your reporting setup.
Drive IT Excellence with Data-Driven Insights
With Freshservice, reports and analytics go beyond static charts to become a continuous source of operational intelligence. From measuring your IT team’s effectiveness to strategically allocating resources, it all starts with having the right information at the right time.
For further reading on IT analytics and data-driven service management, see Freshservice’s official platform resources, IBM's guide to business intelligence, and McKinsey on data-driven enterprises.
Want to see how this works in practice? Book a free consultation with our experts and discover how Freshservice can become the engine of your operational transformation.